Introduction
Hydrofunctions is an open source, free-to-use Python package containing tools for downloading, plotting, analyzing, and storing hydrology data. It is designed to be simple enough for Python beginners, yet powerful enough for scientific research.
Hydrofunctions accesses the the US Geological Survey’s National Water Information System (NWIS), which includes data from thousands of active sensors around the US and Territories. The internal design preserves important metadata while facilitating rapid analysis. Detailed error messages help users figure out why a request went wrong. Sensible defaults make it possible to get started right away while still maintaining your access to all of the NWIS’s sophisticated functionality.
Hydrofunctions is typically used with Jupyter Notebooks, and it incorporates the functionality of Pandas, Numpy, and matplotlib.
Please give it a try!
Features
Retrieves stream data from the USGS NWIS service
Select data using multiple site numbers, by state, county codes, or a boundary box
Preserves NWIS metadata, including NoData values
Helpful error messages to help you write valid requests
Extracts data into a Pandas dataframe, json, or dict
- Plot beautiful graphs in Jupyter Notebooks
hydrographs (or time series of any data)
flow duration charts
cycle plots to illustrate annual or diurnal cycles
Interactive map for finding stream gauge ID numbers
Plotting and manipulation through Pandas dataframes
Retrieve peak discharges, rating curves, field notes, and statistics for sites
Saves data in compact, easy-to-use parquet files instead of requesting the same dataset repeatedly
Quick start
Hydrofunctions can be used from the Python command line, but its graphing capabilities require the use of Jupyter, which is easily downloaded and installed from Anaconda.org.
Before we use Hydrofunctions, we must download and install it on our local computer. You can do this from your computer’s command line prompt, which you can access from your recently installed Anaconda distribution:
(base) C:\> pip install hydrofunctions
Pip will make sure that you have everything that you need on your computer, and load everything you don’t have.
Now, open a new Jupyter notebook. You can find an icon for Jupyter within the Anaconda Navigator application.
In the first cell, import hydrofunctions for use on your page:
>>> import hydrofunctions as hf
To enable chart plotting in Jupyter, add:
>>> %matplotlib inline
Next, request ten days of data from the USGS National Water Information System (NWIS):
>>> site = '01570500'
>>> harrisburg = hf.NWIS(site, 'iv', period='P10D')
Requested data from https://waterservices.usgs.gov/nwis/iv/?format=json%2C1.1&sites=01570500&period=P10D
Use the ‘ok’ attribute to check that the transfer went okay:
>>> harrisburg.ok
True
Find out about what we collected:
>>> harrisburg
USGS:01570500: Susquehanna River at Harrisburg, PA
    00045: <30 * Minutes> Precipitation, total, inches
    00060: <30 * Minutes> Discharge, cubic feet per second
    00065: <30 * Minutes> Gage height, feet
Start: 2019-04-06 00:30:00+00:00
End:   2019-04-15 23:00:00+00:00
This listing reports the site ID and name for the site we requested, followed by a list of all of the parameters collected at this site. For each parameter, it lists the parameter code, how frequently the data are collected for this parameter, and the name of the parameter written out with units. The start and end times of the dataset are given in Universal Time (UTC).
You can output the data as a JSON dict using the .json attribute, or as a Pandas dataframe by using the .df() method. The .df() method takes parameters to limit what data will go into the dataframe.
View the first five rows of a dataframe that only contains the discharge data:
>>> harrisburg.df('discharge').head()
Our data appears in a table…
datetimeUTC
USGS:01570500:00060:00000
2019-04-06 00:30:00+00:00
44200.0
2019-04-06 01:00:00+00:00
44000.0
2019-04-06 01:30:00+00:00
44000.0
2019-04-06 02:00:00+00:00
43700.0
2019-04-06 02:30:00+00:00
43700.0
Because the .df() method returns a dataframe, you have access to all of the methods associated with Pandas, including .plot(), .describe(), and .info() !
Plot the data using Pandas and mathplotlib:
>>> harrisburg.df('q').plot()
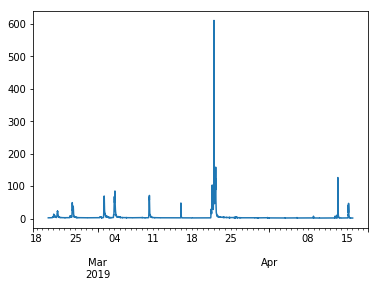
As long as you had %matplotlib inline enabled earlier, you will get a graph.
To learn more about hydrofunctions, try using:
>>> help(hf)
and:
>>> dir(hf.NWIS)
to list all of the methods available.
